I recently needed to profile some C++ code that was taking longer than expected to run. The code was running on a machine without a profiler, so I wrote a handy Timer class that dumps nested timings of each method. You can initialize it to write either to a file or to std::cout if the machine has a console.
I originally thought of this as a ‘Poor Man’s Profiler’, but having used it there are real benefits to taking the trouble to instrument your own code – you can use the file dumps to swiftly compare performance between code changes; you can print out performance statistics and take along to meetings.
#include <iostream>
#include <chrono>
class TimerOutput
{
  public:
    TimerOutput( const std::string file_path = "" ) :
      file_path_( file_path )
    {
      if ( !file_path_.empty() )
      {
        file_.open( file_path_ );
      }
    }

    std::ostream& Stream()
    {
      if (file_path_.empty() )
        return std::cout;
      else
        return file_;
    }

private:
    std::string file_path_;
    std::ofstream file_;
};

class Timer
{
public:
    Timer( const std::string& description ) :
      description_(description),
      start_(std::chrono::system_clock::now())
    {
        applyIndent();
        timer_output_->Stream() << "Start " << description_.c_str() << "\n";
        ++indent;
    }

    ~Timer()
    {
        --indent;
        const std::chrono::time_point<std::chrono::system_clock> finish = std::chrono::system_clock::now();
        auto milliseconds = std::chrono::duration_cast<std::chrono::milliseconds>(finish - start_).count();

        applyIndent();
        timer_output_->Stream() << "Finished " << description_.c_str()
            << ", took " << milliseconds << " (ms)" << "\n";
}

private:
    void applyIndent() const
    {
        for ( size_t i = 0; i < indent; ++i )
        {
            timer_output_->Stream() << "--";
        }
    }

    static size_t indent;
    static TimerOutput* timer_output_;
    std::string description_;
    const std::chrono::time_point<std::chrono::system_clock> start_;
};

#define INITIALIZE_PROFILING_TO_CONSOLE() \
  TimerOutput timer_output; \
  size_t Timer::indent = 0; \
  TimerOutput* Timer::timer_output_ = &timer_output;

#define INITIALIZE_PROFILING_TO_FILE( path ) \
  TimerOutput timer_output( path ); \
  size_t Timer::indent = 0; \
  TimerOutput* Timer::timer_output_ = &timer_output;

#define TIME( description, f ) \
  { \
    Timer profiler( description ); \
    f; \
  }
The obvious limitation of my solution is that it uses a class static to achieve the levels of nesting, so it won’t work on multi-threaded code – but it was great for my purposes. Here’s some sample code that shows it in action:
#include "stdafx.h"
#include <thread>
#include <fstream>
#include "..\MusingStudio\Profiler.h"
//INITIALIZE_PROFILING_TO_CONSOLE()
INITIALIZE_PROFILING_TO_FILE( "c:/temp/timings.txt" )
void method2()
{
TIME( "method2",
std::chrono::milliseconds short_wait( 5 );
std::this_thread::sleep_for( short_wait );
)
}
void method1()
{
TIME( "method1",
TIME( "loop",
for ( int i = 0; i < 5; ++i )
{
method2();
}
)
TIME( "expensive algorithm",
std::chrono::milliseconds wait( 100 );
std::this_thread::sleep_for( wait );
)
)
}
void method3()
{
TIME( "method3",
std::chrono::milliseconds long_wait( 500 );
std::this_thread::sleep_for( long_wait );
)
}
int main(int argc, char* argv[])
{
TIME( "main",
method1();
method3();
)
return 0;
}
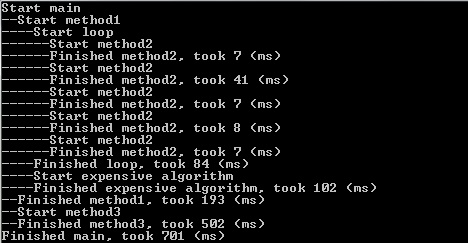
Here’s the output from the sample code:

 but this one had me stumped. The actual algorithm didn’t seem too hard, although there is a bit of a trick to it. The problem I had was extending the solution afterwards to handle large numbers. Usually, it’s enough to use ‘long long’ throughout, but it still wasn’t passing all the test cases.